01
NGA-aligned methodology
Australian National Greenhouse Accounts methods, not a generic corporate calculator.
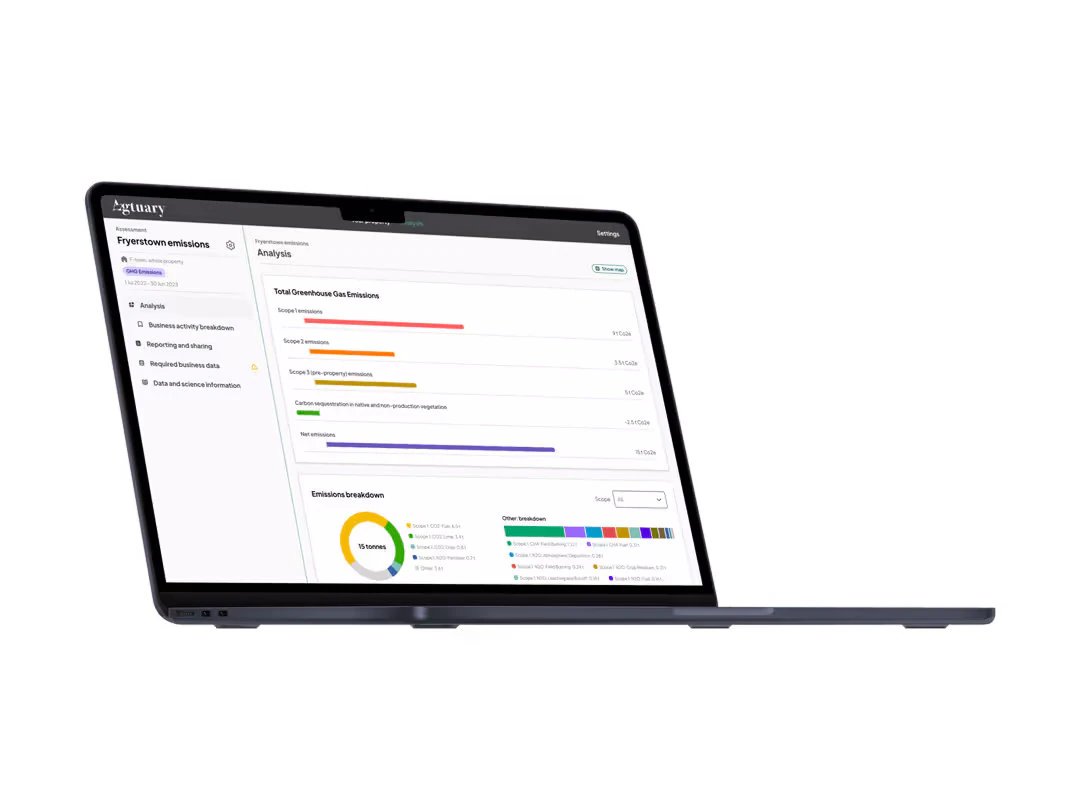
Agtuary emissions accounting aligns Australian farm and portfolio inventories to NGA methods, with Scope 1, 2 and 3 treatment and documented assumptions beside every total.
Trusted by rural teams at








Supply chains, lenders and boards ask for agricultural emissions. They also ask how the number was built. If the method is not on the page, the number does not survive the next review.
Livestock, fertiliser, fuel and land use get treated differently across a portfolio. Totals cannot be compared.
Without a documented boundary, Scope 3 either disappears or gets invented. Neither version belongs on a credit or disclosure file.
If the factors and activity data are not stored against the property, next year's report starts from zero.
Australian National Greenhouse Accounts methods, not a generic corporate calculator.
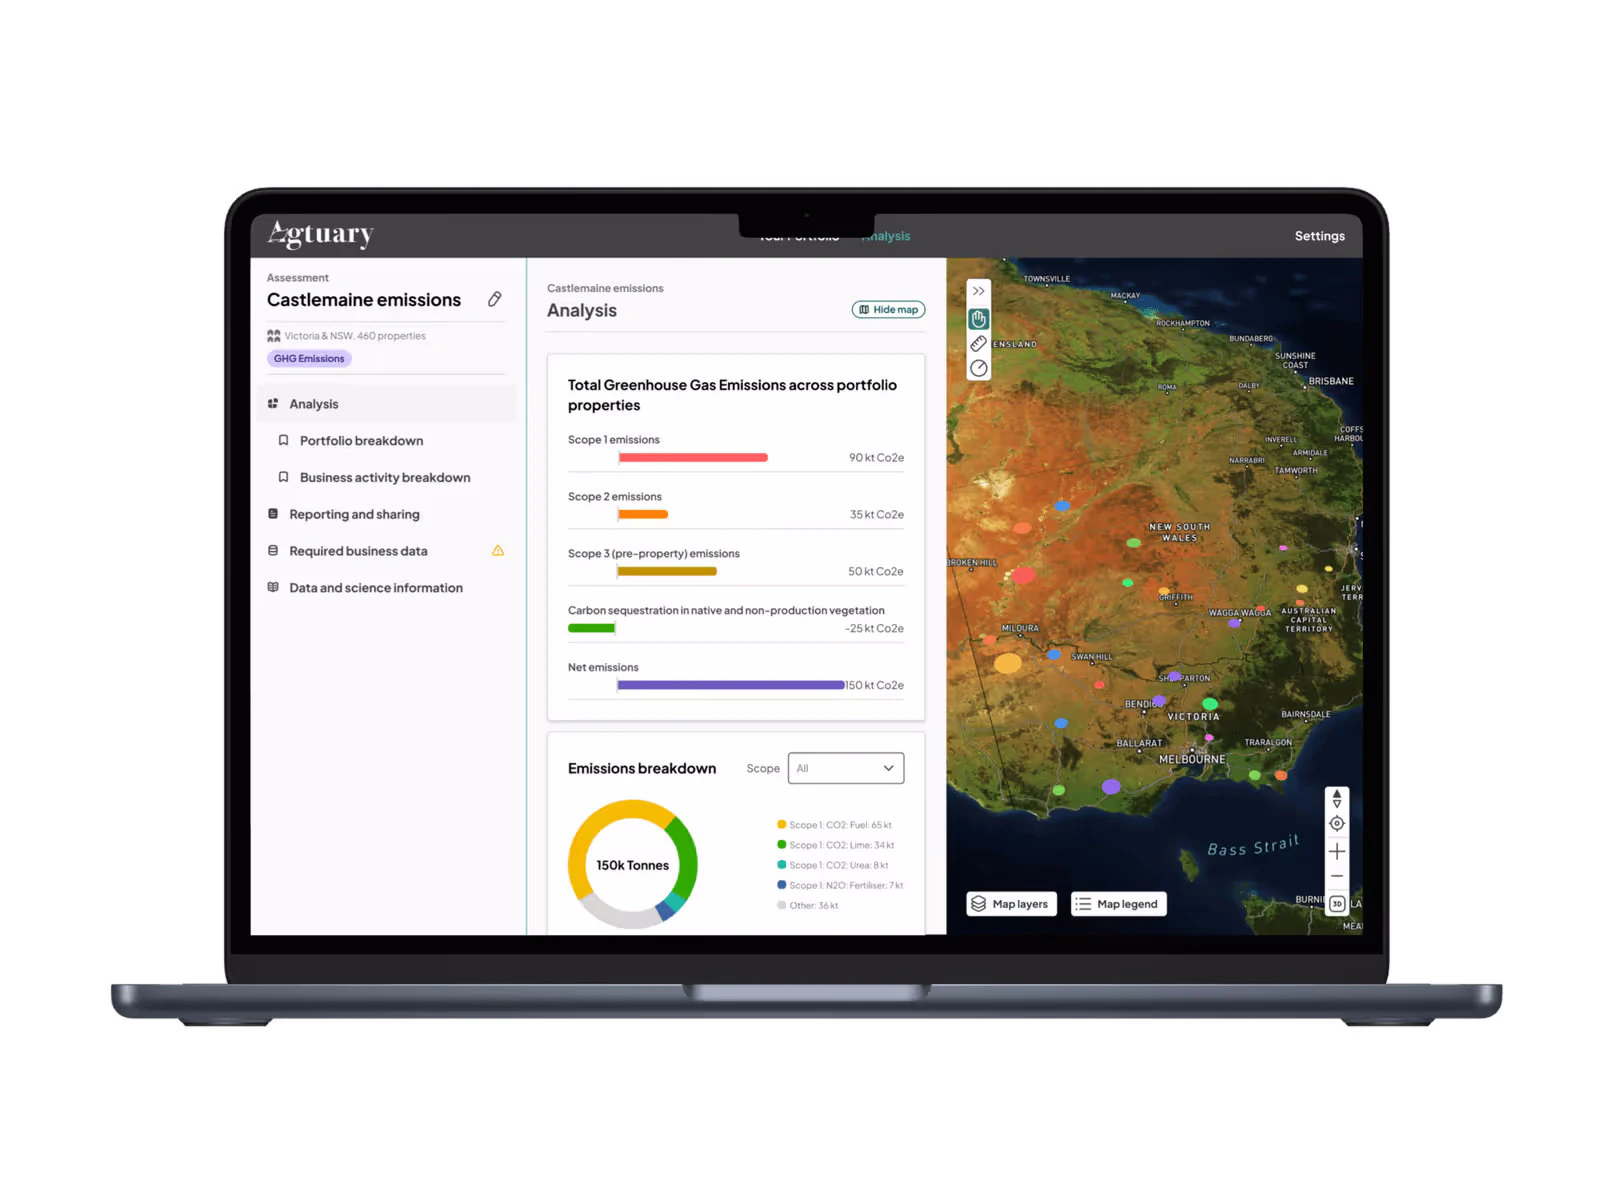
Treatment and boundary documented with the result, so reviewers can see what is in and what is out.
Livestock, fertiliser, fuel, electricity and land use captured against the property.
The same emission factors on every holding in a portfolio, so totals can be compared.
Outputs built for banks, supply chains and advisors - not a dashboard screenshot.
Placeholder
Assumptions & limitations panel
Crop of the emissions report showing boundary notes and assumptions.
16/10
Limitations travel with the number. That is what a second reviewer actually reads.
Livestock, fertiliser, fuel, electricity and land use sit on the same record as the map.
Consistent factors and a documented Scope 1, 2 and 3 boundary.
Send the file to the bank, the processor, or the board with assumptions attached.
Placeholder
Emissions report PDF cover
Cover or first page of a generated agricultural emissions report.
16/10
Agricultural emissions accounting is part of Professional, with unlimited KYE and CMA reports.
Compare plans →Calculations use Australian NGA methods and include agricultural emission sources.
Activity data can include livestock, fertiliser, fuel, electricity, and land-use related sources, with emission factors applied consistently across a portfolio.
Scope 1, 2, and 3 treatment is documented so reports can be used in supply-chain and finance conversations, with assumptions and limitations shown.
Portfolio aggregation lets organisations compare properties and track changes over time. An independent audit is required where external assurance is needed.
“Since we've started using Agtuary to support our clients and inform our finance partners of their historical performance data, knowing their environment and understanding the comparable sales data we've seen a huge value add uplift from the paddock to the board room.”
Calculate property and portfolio emissions from activity data and NGA emission factors.